The Performance Dashboard displays real time performance metrics of the group during the workout. The dashboard shows the relevant metrics such as Power, Cadence and Burned Calories. Each element displayed provides a color hint aiming members to train at the desired zone:
Toggle the Performance Dashboard
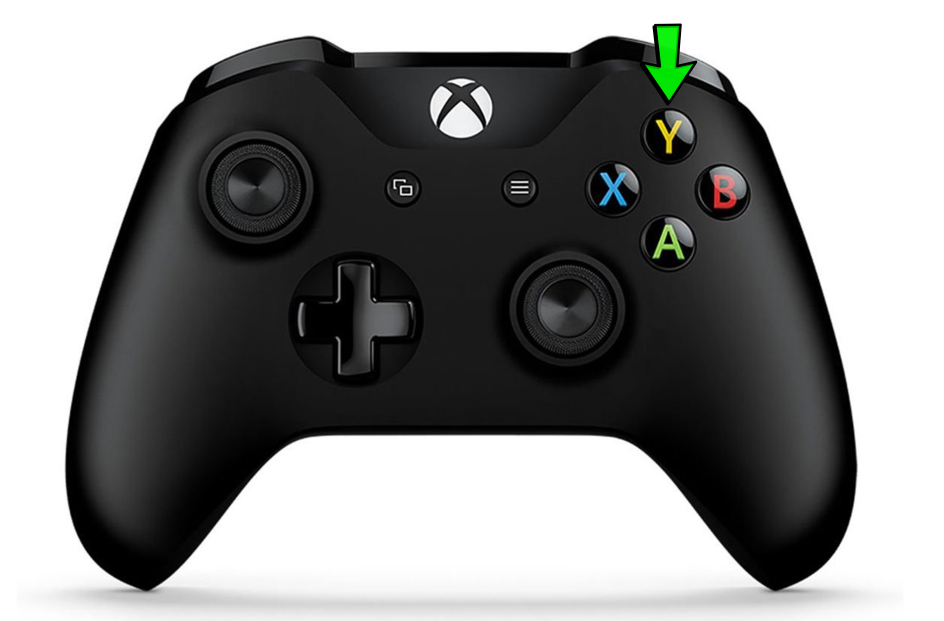
Press the Yellow "Y" button to toggle the Performance Dashboard.
To hide the Performance Dashboard press the Yellow "Y" button once again.
Configuring the Performance Dashboard
The Performance Dashboard can be configured to use either Zone Delta, or Zone Index. You can toggle between the two choices using the System Settings Menu
Zone Delta
When Zone Delta is selected, the colors of the performance dashboard view will be either Gray, Red, or Green:
- Gray means that you’re training below the effort zone.
- Red means that you’re training above the effort zone.
- Green means that you’re training within the zone.
Zone Index
When Zone Index is selected, the colors of the performance dashboard view correspond to the current Zone each member is in. The default zone colors are:
- Black corresponds to Below Zone 1.
- Gray corresponds to Zone 1.
- Blue corresponds to Zone 2.
- Green corresponds to Zone 3.
- Yellow corresponds to Zone 4.
- Red corresponds to Zone 5.
- Bright Red corresponds to Above Zone 5.
To edit the default colors and ranges of your fitness zones, click HERE.
Comments
0 comments
Article is closed for comments.