Click the Club Analytics & Reports link on the My Studio page of spivi.com to view performance data from any class that ran on Spivi® at your club.
Classes
On the first screen, select the desired class from the list. 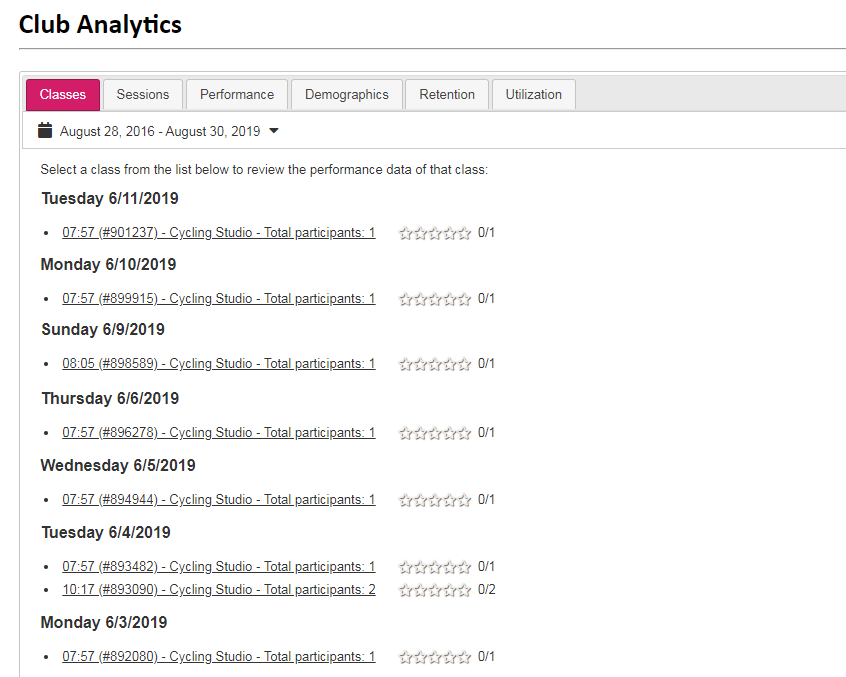
After clicking on the desired class, you'll be directed to the Class Summary Report , which will show the averages and accumulated values for each participant.
Click the " ... " next to the Member name, then click on the graph icon on the left to see a more detailed summary of the class performance for each member.
Download workout data as FIT file by clicking the cloud icon.
Sessions
The sessions tab will allow you to view the charts for the following data:
- Average workout duration (Seconds/Time)
- Total workout duration per day (Seconds/Time)
- Classes per day
- Average participants count per class
- Log-in percentage
- Logged-in vs non-logged-in members

Performance
The performance tab will allow you to view your club’s performance charts for the following data:
- Total Calories Burned
- Total Distance
- Average RPM
- Average Power
- Max RPM
- Max Power
- Total Spivi Points
- Max Speed
- Average Power (FTP)
- Total WPP

Demographics
The demographics tab will allow you to view your club’s performance charts for the following data:
- % of female participants
- % of male participants
- Average age of female participants
- Average age of male participants
- Average age of all participants

Retention
The retention tab will allow you to view your club’s most engaged users for the selected period. It will display:
- # of Classes Taken
- All Time Classes Taken
- First Class Date
- Last Class Date
- Days Active
- Spivi Points

Utilization
The utilization tab will allow you to view the charts for the following data:
- Classes taken
- Class fill rate

Comments
0 comments
Article is closed for comments.